chainsawriot
Home | About | ArchiveEvolution of manpower in HA
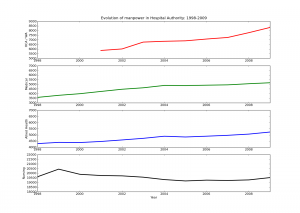
這不是用 R 畫的,是用 Pylab 。數據來自 98 至 09 年 HA Statistical report 。
圖中每格是 500 人。
Source code:
from pylab import *

medical = [3581,3804,3979,4222,4460,4617.5,4871.8,4858.8,4898.1,4935.35,5057,5160.5]
nursing = [19614,20435,19880,19746,19710,19567.5,19307.9,19161.7,19248.0,19211.99,19273,19521.6]
allied = [4295,4392,4379,4467,4590,4721,4891,4829.6,4894.3,4965.83,5063.1,5231.1]
hca = [None, None, None, 5848,6011,6751,6837.5,6888.3,7081.7,7251.13,7769.6,8329.9]

year = [1998, 1999, 2000, 2001, 2002, 2003, 2004, 2005, 2006, 2007, 2008, 2009]
subplot(4,1,1)
title('Evolution of manpower in Hospital Authority: 1998-2009')
plot(year, hca, 'r-', linewidth=3)
axis([1998, 2009, 5000, 9000])
ylabel('HCA / WA')
subplot(4,1,2)
plot(year, medical, 'g-', linewidth=3)
axis([1998,2009,3000,7000])
ylabel('Medical')
subplot(4,1,3)
plot(year, allied, 'b-', linewidth=3)
axis([1998, 2009, 4000, 7000])
ylabel('Allied Health')
subplot(4,1,4)
plot(year, nursing, 'k-', linewidth=3)
ylabel('Nursing')
axis([1998, 2009, 18000, 22000])
xlabel('Year')
show()
