chainsawriot
Home | About | ArchiveHow I usually learn R and PCA in R
昨天上學講到 Principal Component Analysis ( PCA ),其中有條習題,是不需要做的。但出於好奇, ((及好勝)) 我又想試下做。見到阿蛇筆記上的圖片及 output ,像是用 SAS 製作。我又想用 R 玩玩。
我沒有在 R 做過 PCA ,就算在 SPSS 也只是玩過一兩次。故此想邊學邊做。之前講過學習的方法,最重要是自學。我教你怎樣用 R 來做 PCA 是無意義的。反而是怎樣的去自學才是重要。未來遇到問題都可自行解答。學習分析數據,我認為沒有方法比拿真的數據去分析更有效。

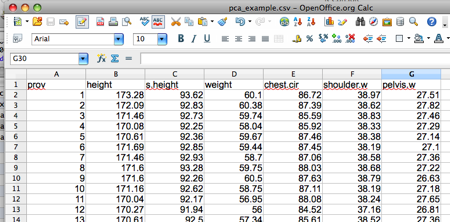
任何的分析都是由數據輸入開始。我已經為你入好。貫切完全公開源碼的精神,我是用 OpenOffice.org 來輸入數據。 ((當你的上頭牙牙聲說,研究部門正版軟件支出很貴呀。你應該告訴他們改用免費的公開源碼軟件,再用原先預算來買軟件的研究費用改為僱用敢去學及敢去用公開源碼軟件的員工,例如我。)) 數據會被儲存為 CSV 格式。
數據是一堆男人的 body measurement ,分別是高度、坐下高度、體重、胸圍 ((講得清楚點,是胸部的周界,即是 chest circumference ,不是 brassiere 。男人的胸圍,真是有的。)) 、肩膀闊度及下盤闊度。每組數據代表一個人的六個不同的 measurement ,故此這六個 measurement 是有很明顯的相關。
如果我想用一兩個數字去總結這六個變數,就得用 PCA ,獲得一些 component 。用 component 取代原始數據的好處,是能夠解決回歸分析的 Multicollinearity 的問題。因為 component 之間是無關係的。
首先是在 R 讀入數據,這個不難。唯獨是不想讀入第一個直行的 ID ,故此要加入 [,2:7]
> morpho < - read.csv(file.choose(), header = TRUE, sep = ",", quote="\"", dec=".",fill = TRUE, comment.char="")[,2:7]

> morpho[1:5,]

height s.height weight chest.cir shoulder.w pelvis.w

1 173.28    93.62  60.10     86.72      38.97    27.51

2 172.09    92.83  60.38     87.39      38.62    27.82

3 171.46    92.73  59.74     85.59      38.83    27.46

4 170.08    92.25  58.04     85.92      38.33    27.29

5 170.61    92.36  59.67     87.46      38.38    27.14
似乎數據讀入順利。到底那一個指令是做 Principal component analysis 的呢?我們可以查查 help 。我們用 principal 作為關鍵字。 ((當然你也可以 Google ))
> help.search("principal")
應該會彈出 Help file 內有 Principal 這個字眼的指令。其中一個叫做 princomp 是我們想要的東西。
通常我會直插到 example ,以修改 example 來學習。似乎 formula interface 那些是我想要的東西。就抄出來試行看看。
> princomp(~ ., data = USArrests, cor = TRUE)
哈哈,很有趣。那是找一個 component 去解釋美國罪案情況。通常 run 完再回頭看 Help 講甚麼也可。看到那個 cor=TRUE 是指用 correlation matrix 來計算。代表每個變數的 Variance 將會成為 1 ,六個變數的總 Variance 數最大為 6 。此外,亦因為為本來的六個變數的單位都不同,使用 correlation matrix 計算更合理。如果 cor = FALSE ,代表使用 Covariance Matrix ,即是只做 Centralization ,較難解釋。
我們可以修改這個 code 去解決我們的問題。將 princomp 的結果存在一個叫 pca.results 的 object 。
> pca.results < - princomp(~., data=morpho, cor=TRUE)

> pca.results

Call:

princomp(formula = ~., data = morpho, cor = TRUE)

Standard deviations:

Comp.1    Comp.2    Comp.3    Comp.4    Comp.5    Comp.6

1.7818619 1.1451024 0.9646748 0.6335397 0.3876169 0.1774592

6  variables and  28 observations.
似乎都沒有特別的東西看到。這裡要介紹一個特別的指令,叫做 str() 。我們可以看看 pca.results 其實存著些甚麼。
> str(pca.results)

List of 7

$ sdev    : Named num [1:6] 1.782 1.145 0.965 0.634 0.388 ...

..- attr(*, "names")= chr [1:6] "Comp.1" "Comp.2" "Comp.3" "Comp.4" ...

$ loadings: loadings [1:6, 1:6] -0.522 -0.525 -0.514 -0.341 -0.185 ...

..- attr(*, "dimnames")=List of 2

.. ..$ : chr [1:6] "height" "s.height" "weight" "chest.cir" ...

.. ..$ : chr [1:6] "Comp.1" "Comp.2" "Comp.3" "Comp.4" ...

$ center  : Named num [1:6] 170.4  92.2  57.6  86.0  38.5 ...

..- attr(*, "names")= chr [1:6] "height" "s.height" "weight" "chest.cir" ...

$ scale   : Named num [1:6] 1.411 0.676 1.753 1.638 0.446 ...

..- attr(*, "names")= chr [1:6] "height" "s.height" "weight" "chest.cir" ...

$ n.obs   : int 28

$ scores  : num [1:28, 1:6] -3.4434 -2.6239 -1.6540 -0.0467 -1.0709 ...

..- attr(*, "dimnames")=List of 2

.. ..$ : chr [1:28] "1" "2" "3" "4" ...

.. ..$ : chr [1:6] "Comp.1" "Comp.2" "Comp.3" "Comp.4" ...

$ call    : language princomp(formula = ~., data = morpho, cor = TRUE)

- attr(*, "class")= chr "princomp"
似乎 sdev 、 loadings 及 scores 會是有趣的東西。我們可看看。如
> pca.results$sdev

Comp.1    Comp.2    Comp.3    Comp.4    Comp.5    Comp.6

1.7818619 1.1451024 0.9646748 0.6335397 0.3876169 0.1774592
不知道為何 R 會出每個 component 的 Standard Deviation ,一般軟件都會出 Variance 。但轉成 Variance 亦不難,只是將 SD 二次方。
> pca.results$sdev^2

Comp.1     Comp.2     Comp.3     Comp.4     Comp.5     Comp.6

3.17503184 1.31125958 0.93059746 0.40137250 0.15024684 0.03149177
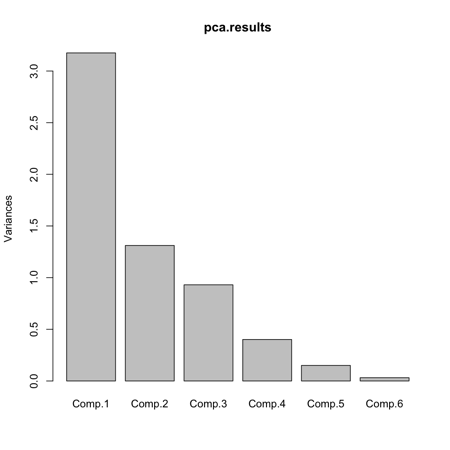
這個 variance 其實即是所謂的 eigenvalue 。要是 eigenvalue 大過 1 通常會指那個 component 能夠代表原來的變數。我們可以用 Scree plot 將 eigenvalue 圖像化。可使用 help.search 找 scree 。會找到指令是 screeplot 。又試玩一下。
> screeplot(pca.results)

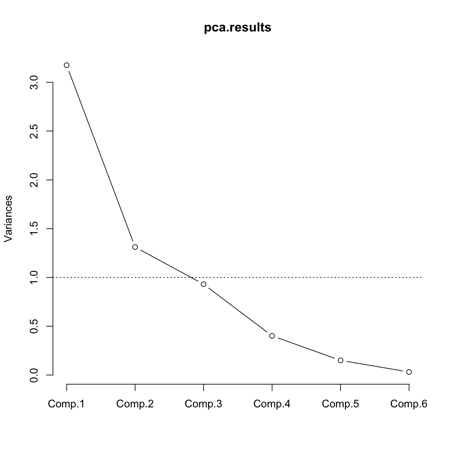
點解會是 bar chart 。再看看 ?screeplot ,原來有個 option 是 type ,可選為 type = "lines" 。
> screeplot(pca.results, type="lines")
亦可在 y=1 加條橫線。
> abline(h=1, lty=3)

由此可見只有 Component 1 和 2 的 eigenvalue 大於 1 。另一個方法是這樣。就是畫出兩個斜坡( Scree )的相交點。似乎都在說,只有 Component 1 和 2 有用。

從 eigenvalue 知就, Component 1 一個頂原本的三個變數的 Variance 、 Component 2 一個變數多一點。單單這兩個 component 就估了 3.17+ 1.31 = 4.48 個 Variance 。以總數 6 為計,只用兩個 component 就佔了 75% 原來的 Variance 。如果你不是太滿意的話,可用埋 Component 3 。到時就會是 3.17 + 1.31 + 0.93 = 5.41 ,即 90% 的 Variance 。
還有就是 loadings 。這個東西,是每個變數要怎樣計才能成為 component 。如果 loading 太細的話,即是那一個變數與這個 component 的關係不大。
> pca.results$loadings

Loadings:

Comp.1 Comp.2 Comp.3 Comp.4 Comp.5 Comp.6

height     -0.522 -0.186 -0.221  0.223  0.233  0.735

s.height   -0.525        -0.187  0.363  0.333 -0.664

weight     -0.514 -0.146        -0.282 -0.785

chest.cir  -0.341 -0.132  0.736 -0.468  0.325

shoulder.w -0.185  0.690 -0.399 -0.527  0.231

pelvis.w   -0.193  0.667  0.453  0.493 -0.244

Comp.1 Comp.2 Comp.3 Comp.4 Comp.5 Comp.6

SS loadings     1.000  1.000  1.000  1.000  1.000  1.000

Proportion Var  0.167  0.167  0.167  0.167  0.167  0.167

Cumulative Var  0.167  0.333  0.500  0.667  0.833  1.000
而 score ,是每個人的 component score 。
> pca.results$score[1:5,]

Comp.1      Comp.2     Comp.3     Comp.4     Comp.5      Comp.6

1 -3.44336265  0.55184880 -0.6815001  0.4703733  0.2595271  0.07299872

2 -2.62391305  0.72645579  0.6948350  0.4399728 -0.7003896  0.27874120

3 -1.65402122  0.70641717 -0.5713728  0.1852374 -0.5829266  0.01312268

4 -0.04669495 -0.01703453  0.2648561  0.2567248 -0.3696771 -0.19803468

5 -1.07090652 -0.54672030  0.5261482 -0.5572598 -0.5292849 -0.17212832
這是頭五個人的 component score 。如你想獲得所有人的 component 1 的 score ,可用 matrix 的存取法則。 ((matrix 後的方括號,可以用 coma 來存取某特定的數據。 coma 前是橫行。如上例 1:5 是指我只想要第一至第五橫行。 coma 後就是直行,例如 [,1]代表只要第一直行。))
> pca.results$score[,1]
我們可以這些 score 來做回歸分析,以此來代表原本的六個變數,就沒有 multicollinearity 的問題。也可看看原來的變數與這個 component 的相關系數。
> cor.test(pca.results$score[,1],morpho$height)

Pearson's product-moment correlation

data:  pca.results$score[, 1] and morpho$height

t = -12.8432, df = 26, p-value = 9.171e-13

alternative hypothesis: true correlation is not equal to 0

95 percent confidence interval:

-0.9671482 -0.8516642

sample estimates:

cor

-0.9294281
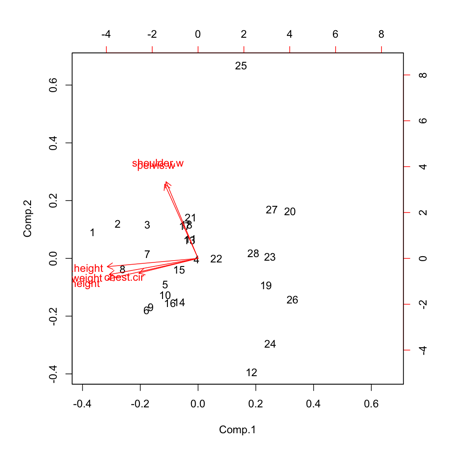
我們也可以用 biplot 看看兩個 component 與原來的變數之關係。
> biplot(pca.results)

從圖中所見。原來的變數被分成兩堆。之後的已經是 factor analysis 的問題。這個 PCA 已經完成。
Source Code 可於這裡下載。