chainsawriot
Home | About | Archive蒙地卡羅
繼續唔理你感受: 這又是私人研究。返學講到這個 topic ,但沒有講應用。
Come on! 你知道為甚麼是寫在這裡嗎?因為現實中根本沒有使用的可能。人們根本不會 care 你有沒有做的!無處宣洩只好在這裡。
正如書本教你,當你收集數據後,發現有 missing data 應怎樣處理。書本中是教的是 Hot-deck imputation 。你有聽過研究報告有人會 report 他曾經用過 Hot-deck imputation 嗎?哈哈。我想現實中標準的方法是對 missing data 隻眼開隻眼閉。更甚者是將有 missing data 的樣本取走 ((listwise deletion)) ,只作 complete case analysis 。但問題是, missing data 的出現是隨機的嗎?
現代電腦技術能夠做到以前難以想像的統計方式。但以一般醫學研究為例,現在的統計技巧其實與 Apple ][ 年代無甚分別。電腦的普及只是將統計軟件簡單容易化,每個人都會用,但不是每個人都會解讀統計軟件的結果。迴歸分析常用,但當一般人用 SPSS 獲得一堆 p-value 後,他們會去檢查迴歸分析的假設是否正確嗎?
除了老掉牙的 residual analysis 之外,還有另一些方法。電腦現在快到無譜,運算能力高而且平,這些方法不流行煞是可悲。 ((似乎 SPSS 亦要被遣責,因為 SPSS 基本版沒有提供這些方法。)) 似乎電腦的更新與進步,只是 for pr0n 和 for video game 。
這個例子是出自經典的費雪 Iris 數據。在 R ,是內建了這個數據的,就是叫做 iris 。
> str(iris)

'data.frame':	150 obs. of  5 variables:

 $ Sepal.Length: num  5.1 4.9 4.7 4.6 5 5.4 4.6 5 4.4 4.9 ...

 $ Sepal.Width : num  3.5 3 3.2 3.1 3.6 3.9 3.4 3.4 2.9 3.1 ...

 $ Petal.Length: num  1.4 1.4 1.3 1.5 1.4 1.7 1.4 1.5 1.4 1.5 ...

 $ Petal.Width : num  0.2 0.2 0.2 0.2 0.2 0.4 0.3 0.2 0.2 0.1 ...

 $ Species     : Factor w/ 3 levels "setosa","versicolor",..: 1 1 1 1 1 1 1 1 1 1 ...
iris 數據是三種鳶尾花(setosa, versicolor 及 virginica )的花萼長闊度(Sepal Length 及 Sepal Width )及花瓣長闊度(Petal Length 及 Petal Width)。費雪認為花萼及花瓣長闊度可用來為鳶尾花分類。它用這個數據設立了 Linear Discriminant model 。這是這個數據的歷史,現在這個經典數據是會用於一般的統計學書藉甚至人工智能研究。
為了簡化,我只選兩種花來分析,除去數據中的 setosa 種類。
> new.iris < - subset(iris, Species !="setosa")
我們做一個 Logistic Regression 看看 Sepal Length 是否能夠估計鳶尾花的種。
> model1 < - glm(Species~Sepal.Length, family=binomial("logit"),data=new.iris)

> summary(model1)

Call:

glm(formula = Species ~ Sepal.Length, family = binomial("logit"),

    data = new.iris)

Deviance Residuals:

     Min        1Q    Median        3Q       Max

-1.85340  -0.90001  -0.04717   0.96861   2.35458

Coefficients:

             Estimate Std. Error z value Pr(>|z|)

(Intercept)  -12.5708     2.9068  -4.325 1.53e-05 ***

Sepal.Length   2.0129     0.4654   4.325 1.53e-05 ***

---

Signif. codes:  0 ‘***’ 0.001 ‘**’ 0.01 ‘*’ 0.05 ‘.’ 0.1 ‘ ’ 1

(Dispersion parameter for binomial family taken to be 1)

    Null deviance: 138.63  on 99  degrees of freedom

Residual deviance: 110.55  on 98  degrees of freedom

AIC: 114.55

Number of Fisher Scoring iterations: 4
似乎 Sepal Length 是 Species 的 predictor 。更能用 confint 這個 function 來計計 parameter estimate 的 95% CI 。
> confint(model1)

Waiting for profiling to be done...

                  2.5 %    97.5 %

(Intercept)  -18.825319 -7.340756

Sepal.Length   1.176685  3.015218
一般的研究員會將這樣的結果送到期刊,老闆見到「有野睇」非常高興,坐定笠綠等升職。而 reviewer 只要見到 p-value 相當細小,就會異常興奮,欣然決定刊登。所以以下的東西是沒有人 care 的。
到底上面的計算法是否正確?電腦技能如此強勁,應該做的叫做 resampling 。我們從 random resampling 或模擬獲得更多數字,再用這些數字計出一個估值,叫做 Monte Carlo 估值。這種方法叫做 Monte Carlo ,這是一家賭場。賭徒在賭場狂賭,行為是不停重覆。
會做的叫做 bootstrap 。查字典知道 Bootstrap 中文叫做「解靴帶」,來自西諺 "pull up by your own bootstraps" ,即是你掉到海中,無人救你,你應該用鞋帶把自己拉上水自救。合乎香港文化的說法,叫做「食自己」。 ((更加抵死絕核的,應該叫做 .... J.... ))
Bootstrap 的例子如下:
我隨機抽樣了五個人的年齡, 27,30,34,40,42 ,計算其平均數是 34.6 。在這五個數字隨機重新抽樣,抽完可以再抽( sample with replacement ),可以獲得無限組的五個數字,再每次計一個平均數。如:
27,27,30,42,42 = 33.6
27,30,34,34,34 = 31.8
34,34,34,34,40 = 35.2
我們只是用手頭上的數重新抽樣,沒有外力,完全「食自己」。將每次計出來的平均數成一個 distribution ,叫做 Bootstrap sample 。從 Bootstrap sample 可以獲得 2.5 和 97.5 percentile 。我們之前計出來的 34.6 應該在這個 range 之內。
我們將 Bootstrap 應用於之前的 parameter estimates 。上面說到 Sepal length 的 beta 是 2.01 (95% CI: 1.18 to 3.02) ,這個計算是從我們的 sample ( empirical sample )獲得。我們有地方不解。第一,是 beta 的分佈。要是 beta 的分佈不是常態,那些 Standard error 同埋 95% CI 不可信。我們可用 Bootstrap 方法獲得一個 bootstrap sample 。我們可以看看 Bootstrap sample 的分佈。
做 bootstrap 前,對不起,真的要寫 program 。因為要寫一個 function 令電腦回報你想 bootstrap 不停重覆的數字。
> bsa < - function(formula, data, indices) {

	d <- data[indices,]

	fit <- glm(formula, data=d, family=binomial("logit"))

	return(coef(fit)[2])

	}
之後可以用 Boot 指令獲得一個 bootstrap distribution ,重新抽樣 1000 次。你可以增加 R 值。以一台 C2D MacBook ,重新抽樣 10000 次,都只會花數十秒。如果你高興的話,甚至可以增到幾億次。但是一般認為 1000 次都夠。
> boot.results < - boot(data=new.iris,statistic=bsa,R=1000,formula = Species~Sepal.Length)

> boot.results

ORDINARY NONPARAMETRIC BOOTSTRAP

Call:

boot(data = new.iris, statistic = bsa, R = 1000, formula = Species ~

    Sepal.Length)

Bootstrap Statistics :

    original     bias    std. error

t1* 2.012927 0.09547335   0.5014038
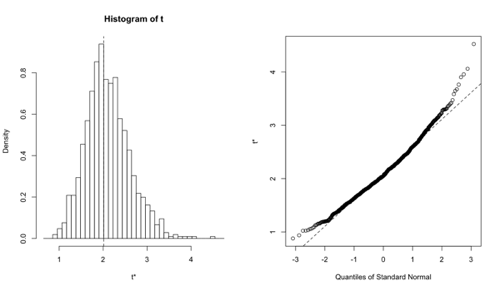
我們可以 plot 出這個 bootstrap distribution 的分析。
> plot(boot.results)
我們能獲這樣的圖。我覺得這個不是常態分佈。似乎之前 Logistic regression 計出來的 SE 和 CI 不能盡信。
我們又可以獲得一個 Bootstrap CI
> boot.ci(boot.results)

BOOTSTRAP CONFIDENCE INTERVAL CALCULATIONS

Based on 1000 bootstrap replicates

CALL :

boot.ci(boot.out = boot.results)

Intervals :

Level      Normal              Basic

95%   ( 0.935,  2.900 )   ( 0.815,  2.826 )

Level     Percentile            BCa

95%   ( 1.200,  3.211 )   ( 1.103,  3.011 )

Calculations and Intervals on Original Scale

Some BCa intervals may be unstable

Warning message:

In boot.ci(boot.results) :

  bootstrap variances needed for studentized intervals
會計出多個不同類的 Bootstrap CI 。由於上面的 histrogram 說明 beta 不像是常態分佈,我們只能用較為保守的 Percentile 。 BCa 是 Percentile 的改良版本,亦都可參考。似乎兩者都沒有包括零。與 Logistic Regression 的結論一樣。
Only after that, 在我的標準來說,上面做出來的 Logistic regression model 才是 publishable 。 ((Sorry ,但我自己都不是次次 do ,所以我做出來的 model 都不是 publishable 的。)) 因為有更多的證據證明你的模型是正確的。
正如一般的統計方法, Bootstrap 都有 assumption:原來的 sample 是一個 representative sample (如 random sample, 當然 sample size 也不應太細),而太多 outliers 也會影響準繩度。
